On November 18, 2019, I gave a department “internal seminar” on the TeachStat Research Group’s work on statistics education research. The internal seminars are intended for faculty in Statistics & Data Science here at CMU to get to know each other’s work better, and to interact with graduate students and faculty from other departments who may also be interested. This is not a transcript, but, as Sir Humphrey would say, “a version which represents my views as I would, on reflection, have liked them to emerge”.
For the past two years, I’ve been working with a group of Ph.D. students and faculty here at CMU on new projects in statistics education research. There have been quite a few people involved:
So what’s the problem we’re trying to solve? It’s a big, long-term problem. It’s one you’ve probably all seen when you teach your classes. There is simply a massive gap between how we think, as statisticians with experience analyzing data, and how our students think, as novices seeing data for the first time. And that gap doesn’t shrink nearly as much as we would like it to during a course.
This manifests in several ways. You might have had the experience of teaching an upper-level class and referring to some concept that the students should already know—only to find that they don’t seem to understand it. You might have taught an introductory class and seen that no matter how carefully you explain the meaning of hypothesis tests, the students still misinterpret them. You might have supervised students conducting a course project and seen that they lack intuition about data or the judgment to decide what to try or how to interpret their results.
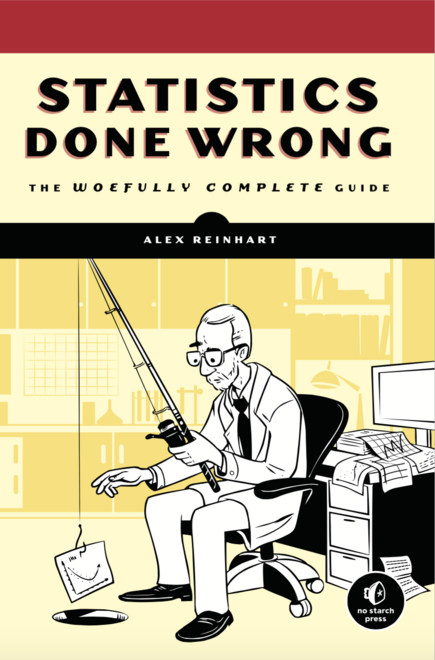
But it’s not just students. Practicing scientists are notoriously bad at the same things: they misinterpret hypothesis tests, misunderstand regression assumptions, overinterpret small effects, read signal into noise… There’s a lot of research on how scientists understand statistical evidence, and there’s also a lot of research on the prevalence of misinterpreted statistical evidence in science. So much research, in fact, that one can even write a book about it all:
We’ve been pursuing two main projects to address this problem.
First, we’ve been examining and measuring student thinking in introductory statistics courses, using think-aloud interviews and assessments to explore their learning.
Second, we’ve been comparing how students and experts think about problems in a sophomore-level mathematical statistics course. Using think-aloud interviews and cognitive task analysis, we’re exploring the skills involved in solving these problems and exploring which skills are preventing students from succeeding.
We’re planning to use this research to build teaching experiments for our courses: our data will show what concepts students struggle with most, and our assessments will let us measure the effects of any new teaching strategy we try.
This section summarizes work we presented in a recent preprint. Read it for more detail!
Let’s start with introductory statistics courses, where students seem to graduate our courses still holding many misconceptions about p values, sampling distributions, experiments and surveys, and all the other core concepts we aim to teach. (For a survey of the literature, check out my notebook on statistical misconceptions.)
Statistics education researchers have tried to quantify the size of the problem. They have developed many concept inventories: multiple-choice standardized assessments that you can give to students at the beginning and end of an introductory statistics course, to measure how much they learn. While we can quibble with the details of these inventories and how they’re constructed, one thing is consistent: pre-test scores are low, and post-test scores aren’t much better. There’s just not much evidence that students are learning the concepts we intend them to in the intro class.
For example, the Comprehensive Assessment of Outcomes in Statistics is the most popular and most thoroughly vetted standardized assessment of student statistical understanding. Large national datasets find average pre-test scores of about 45%, showing that students entering statistics courses have much to learn—but they also find average post-test scores of about 55%, showing that we have much to learn about teaching more effectively.1
There’s a lot of ongoing work on new teaching strategies to improve this. For example, simulation-based inference is a hot topic right now: rather than teaching statistics through formulas and mathematics, simulation-based inference courses teach the concepts of variation and testing through computer simulations. Instead of learning t tests and using tables of distributions, students simulate permutation tests or do a bootstrap. This seems conceptually simpler: they can see directly what they’re doing, they can see that permutation really is making the null hypothesis true by making the two groups equivalent… but the effects are small. At best we’re getting a few more percentage points.2
Now, it’s worth asking why this is not a solved problem. After all, we’ve been teaching statistics for a century. Statistics education has gone through many revolutions, as computers enter classrooms and students get to practice hands-on with real data. And, of course, we all learn from experience. We adjust our courses based on what students got wrong last year. We introduce new demonstrations and simulations for important concepts. We write new homework and new projects on the topics we think students are missing. And yet here we are.
In fact, during my reading of the statistics education research literature, I have not encountered any experiments showing dramatically improved student learning in an entire course. I just read a Journal of Statistics Education article titled “Do Hands-on Activities Increase Student Understanding?,” and the results indeed confirmed Betteridge’s Law of Headlines.3 The same has been happening with simulation-based inference research; the new course designs and new textbooks seem to have only small effects on student learning, and the research is focused on finding exactly which students see a small benefit and which do not.
So why aren’t we making progress? In my view, a key obstacle is our approach. Tinkering with our courses based on intuition, fashion, or frustration is just going to make small steps toward a local optimum. Instead, we need a sound understanding of how our students really think and how they really learn, so we can build new teaching strategies based on systematic knowledge about student learning.
And, of course, we are statisticians. Why do we not teach like statisticians? We need to find ways to model how students learn, so our interventions can be designed based on a formal model of learning. We need to find ways to measure what students learn, so our proposed models can be calibrated and our interventions can be tested empirically. And since we’re statisticians, we need to base our models on real data, and ensure that real data means what we say it does and suits the purposes we want to use it for.
So let’s start with the foundation: measuring student learning. Later I’ll talk about the steps we’re taking to model it, but first we need a foundation of real data.
Our research project began back in summer 2017. In the spring we held a reading group reviewing statistics education research, and we were interested in pursuing education research in the fall. My email over the summer started with somewhat modest goals:
Any ideas on what our goals should be? We had talked about developing an assessment to replace CAOS and judge whether the new statistical reasoning course is working; other potential topics would be more on psychology and pedagogy, different theories of learning, or writing fan fiction about Galton and Gandhi teaming up. (That was Rebecca’s suggestion.)
Our reasoning, however, was somewhat immodest. There are, of course, pre-existing assessments designed to measure if students are learning concepts in introductory statistics. One is the Comprehensive Assessment of Outcomes in Statistics, as I mentioned above. We weren’t fans of these assessments, which we thought focused on the wrong topics and emphasized memorization of definitions and results over understanding of concepts. We wanted something to measure conceptual understanding of the specific concepts we wanted to teach in our introductory course.
We figured that as statisticians, it can’t be too hard to write some conceptual questions and collect data on student answers. How naive we were.
We soon discovered that writing questions is hard. There’s a reason CAOS questions seemed to focus on remembering definitions: it is very hard to write a question that measures conceptual understanding of basic concepts. It is very hard students to reason about statistical questions and reach conclusions, without relying on them remembering specific terms and specific definitions.
Fortunately, we can borrow ideas from other areas of education research. In other STEM fields, particularly physics, there is a long history of developing deeply conceptual concept inventories to get at how students think and reason about new situations. This work has been going on since at least the 1990s, and has led to some remarkable results.
The method we adopted was described best by Wendy Adams and Carl Wieman in a paper describing how to build assessments to “measure learning of expert-like thinking”.4 They describe an iterative method:
The method that Adams and Wieman advocated for was actually developed here at CMU, by Herb Simon and Anders Ericsson, back in the late 1970s and early 1980s. As part of their work in artificial intelligence and expert systems, they were interested in learning how human experts reason about complex problems. They developed what they called verbal protocol analysis, and what we now call “think-aloud interviews”, and used these interviews to figure out how an AI system should be designed to think like an expert. A think-aloud interview gets us the closest thing to actual student thinking that we can get without full brain-computer interfaces.5
In a think-aloud interview, a student—just one student, in a private setting like a conference room—is given one conceptual question to answer. They read it aloud, then say everything they are thinking as they try to find the answer. The interviewer just watches. The interviewer doesn’t prompt the student, offer help, ask questions, or anything else. The goal is to get the student’s authentic thinking, as they would have thought it while answering a question on their own, without the influence from an experimenter making them reflect on decisions or suggesting different strategies. (For practical details and further literature, see my notebook on think-alouds.)
We’ve now completed 47 hour-long think-aloud interviews with students at CMU and at Colby College, covering more than 50 conceptual questions. The results of these interviews are quite dramatic. We found that students frequently misinterpreted questions that we thought were perfectly clear, because students understood wording differently than we did. We found some questions that students could solve entirely through elimination or by using heuristics like “it’s never the answer with ‘always’ in it.” We found that some questions measured completely different thinking than we expected to measure.
As a quick example, we had a question about sampling distributions that we thought was quite good, until think-aloud interviews revealed that most students got it wrong—and got it wrong because they did not understand how to read histograms. Only after we rephrased the question to eliminate these misunderstandings could we trust that students get it wrong because of reasons related to their understanding of sampling distributions, and not of histograms. (For the full story, check out our eCOTS 2018 video poster.)
This process gave us confidence in our questions. Having seen real students answer the questions, and having heard everything they said while answering them, we now know why they are answering those questions and how they are interpreting them. We eliminated or fixed many questions that turned out to be confusing or elicited student reasoning unrelated to the concepts we intended to measure.
Along with the interviews, we’ve been collecting quantitative data from students in introductory courses at three different institutions. We started collecting data at Carnegie Mellon and at Colby College in spring 2019, extending to the College of Wooster in fall 2019. We’ve also collected data from students in 36-202, the second-semester statistics class in our department, to see what they retained after the first course. We hope to expand to more institutions in subsequent semesters.
Students complete the pre- and post-test online, through ISLE, the Integrated Statistics Learning Environment. ISLE presents them with 30 questions in random order and records the data; students get course credit for completing the assessment as part of their first homework and as part of their last homework. They can, of course, opt out of having their data used for research purposes.
The data is useful, and helps us measure changes in the course. But we also found that the access to student thinking we get in think-aloud interviews gave us much deeper insights into student learning.
Consider this question:
A survey of Californians found a statistically significant positive correlation between number of books read and nearsightedness.
Which of the following can we conclude about Californians?
A. Reading books causes an increased risk of being nearsighted.
B. Being nearsighted causes people to read more books.
C. We cannot determine which factor causes the other, because correlation does not imply causation.
D. We cannot draw any conclusions because Californians aren’t a random sample of people.
We wanted to test how students understand correlation and causation. We knew, from teaching experience, that introductory students struggle to understand the purpose of randomized experiments and how that differs from random sampling. We also know that people tend to be too willing to draw causal conclusions. So this question was intended to test that understanding. In interviews, and in later data we collected in class, students did quite well on this question. Great, you might think—they get it! But slow down.
Here’s another question we tested in think-aloud interviews.
A clinical trial randomly assigned subjects to receive either vitamin C or a placebo as a treatment for a cold. The trial found a statistically significant negative correlation between vitamin C dose and the duration of cold symptoms.
Which of the following can we conclude?
Here, correlation is causation. Because the subjects were randomly assigned, there can be no systematic confounding. Students in interviews answered correctly, and you might assume this means they understand the purpose of randomization—but it doesn’t!
Instead, we observed several students who strongly believed that correlation does not equal causation, and made statements to that effect while answering the question, but then said that this specific case “makes sense” and chose the answer that a causal conclusion can be drawn. One student specifically said that you “usually can’t assume causation,” then said it’s just correlation, then chose the causal answer. Perhaps, we thought, our students were getting the right answer simply because they already believed that vitamin C would help a cold, not because they were applying statistical reasoning.
To test this hypothesis, we tried a new version of the question. We replaced vitamin C, which makes sense as something that might cure colds,6 with mindfulness meditation. We thought this would avoid the reasoning that the treatment “makes sense,” and would better test whether students really understand the purpose of random assignment:
A clinical trial randomly assigned subjects to either practice mindfulness meditation or a placebo relaxation exercise as a treatment for a cold. The trial found that subjects who practiced mindfulness meditation had a shorter time to recovery than students assigned to the relaxation exercise, and the result was statistically significant.
Which conclusion does this support?
The results were dramatically different. Students now insisted that “causes” is too strong a word, and voiced doubts about the possibility of ever proving a causal claim. A couple of choice quotes:
7 of the 11 students who answered this version of the question in think-aloud interviews got it wrong, answering that correlation is not causation.
We also administered these questions to most students in the class, at the end of the semester. They seem to consistently prefer to deny causal relationships: most students correctly said that in the books question, correlation is not causation, but also said that in the meditation question, correlation is not causation. A smaller proportion recognized that in the meditation question, correlation really is causation.
| books wrong | books right | |
|---|---|---|
| meditation wrong | 10 | 67 |
| meditation right | 9 | 50 |
That’s exactly the kind of insight we gain by doing interviews instead of just handing out questions. We learned that students were using different reasoning than we expected—they were picking answers because they already believed in the use of Vitamin C—and were able to write new questions to give us a deeper understanding of their reasoning. We now have a small piece of the puzzle in figuring out how to better teach these important concepts.
The results above were from the post test, but the pre-test results were similar, suggesting something else very interesting: that students enter the course already possessing these misconceptions.
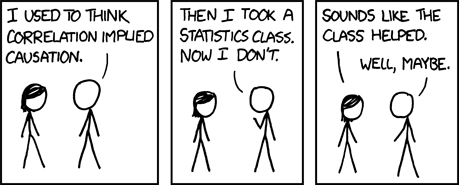
So where does that leave us? It appears that students are a bit like Cueball in this xkcd cartoon: they don’t think correlation implies causation, but that doesn’t mean the class helped. Crucially, they don’t understand when correlation does imply causation. Students seem to enter the class with misconceptions, so the problem may not be that we are teaching them bad habits, but that we are failing to break them.
This gets to a key reason why think-aloud interviews are so important.
Instructors often subscribe to what I call the “empty vessel theory” of teaching. Students begin the semester as empty vessels; as instructors, our job is to carefully distill all the important concepts of the course and carefully pour them into the empty vessel. As long as we use only high-quality ingredients and mix the explanations well, the students will leave the course filled with knowledge.
But, of course, that is not how it works. Students enter our courses with many beliefs about the world and how it works. When they hear our explanations, they do not simply accept them at face value; they already know things, or think they know things, and try to fit our explanations into their existing mental models.
There has been a lot of research on this problem in other fields. Notably, in physics, researchers since the 1980s have explored the numerous misconceptions and prior beliefs students hold about basic Newtonian mechanics. Students enter introductory physics courses having seen that objects in motion do not stay in motion, and with colloquial understandings of terms like “force,” “energy,” “momentum,” and so on.7
And because students “know” these things, they misinterpret our explanations of those same concepts in class. Our explanations do not work because they understand our words differently than we do. Our explanations do not produce a clear understanding in the students because they fit the explanations together with their prior “knowledge” and produce a disjointed, inconsistent understanding.
We have every reason to believe something similar is happening in statistics education. Our students in interviews applied their prior knowledge to override whatever we might have taught about randomized experiments and causality. We have also seen students in interviews appearing to hold multiple mutually incompatible ideas on how to approach problems, switching from one to the other whenever the first doesn’t seem to work—without reflection on how they may be inconsistent.
Fortunately, the education research literature also suggests that this problem can be tackled. It can be tackled when instructors are aware of the misconceptions and approach them head-on, and particularly when instructors use “interactive engagement” teaching strategies that ask students to answer questions and make predictions in class, discussing their predictions with their peers and getting immediate in-class feedback when they are wrong. Extensive data shows these strategies can double or triple student learning.8 I suspect much of these gains come because students are forced to integrate what they learn in class with their prior beliefs immediately, as they sit in the classroom, instead of passively nodding and accepting a lecture without serious thought.
We hope that think-aloud interviews, combined with our assessment data, can make it possible to craft introductory statistics courses that achieve similar success. But first it will take much more research to fully understand how students think.
From spring, summer, and fall 2019, we have some preliminary results. These are from giving our assessment questions to our existing classes, taught with their usual teaching strategies. You can see here that the mean scores from pre- to post-test do not change dramatically, although there is a sampling bias—some students are not motivated to get a few points at the end of the semester, apparently, so response rates are lower at the end of the semester—that makes strong conclusions hard to draw. Fortunately we are working on addressing that bias in future semesters, and we can match students between pre- and post-test to conduct matched pairs analyses.
| Section | Pre-test mean | Post-test mean |
|---|---|---|
| CMU 200 | 46.5% | 53.0% |
| Colby SC 212 | 51.1% | 59.9% |
| CMU 202 | 57.0% |
The small learning gains don’t exactly fill us with hope. But they are not anomalous: prior research using CAOS and other conceptual assessments, flawed though they may be, has found similar results. These results us just how far we have to go.
(Our questions and our full assessment results are available as part of the supplemental materials to our recent preprint describing this work.)
But while this gives us 50-odd questions that we are confident in, it’s only the surface. We teach more than just introductory courses. Many of you have taught or TAed more advanced classes, and you see students struggle there too. I’ve heard lots of anecdotes about students in advanced classes who still don’t seem to understand small p values make us reject hypothesis tests, or students who seem to have forgotten everything you swear they must have been taught in prerequisite courses. And we complain that some students seem to want to learn by rote, memorizing procedures without ever developing the statistical thinking they need to succeed. I’ve heard plenty of stories about students who just want to know if their analysis is “right” instead of thinking about what it achieves and how it compares to other methods.
My thesis is that something is wrong with our understanding of how students develop statistical expertise. We’re expecting them to integrate many facts and skills together, then to develop the expertise to know which facts and skills are appropriate to apply to a given problem. How can we explore how students are doing this?
One tool is Cognitive Task Analysis. This sounds like a buzzword, but it’s actually just describing something fairly straightforward.
Cognitive Task Analysis models problem-solving as a series of small, discrete steps. Students go from the problem statement to the solution using many specific steps, and we can use interviews with expert problem-solvers to identify the steps experts take. Then, in think-aloud interviews with students, we can learn which steps they take and establish which steps most often lead to errors and mistakes.
Cognitive task analysis has been widely applied for many purposes. Research suggests explicit cognitive task analysis can help better structure teaching, because experts are usually quite bad at identifying the steps they take to solve problems: if asked how they solved a problem, experts often give explanations that are incomplete or outright contradict the result they actually obtained. The evidence suggests that if instructors use explicit cognitive task analyses to guide the skills they teach in a course, student learning can be significantly improved.9 (For further literature, and ways to assess cognitive tasks quantitatively, check out my notebook.)
Also, cognitive task analysis has already been applied to statistics. Marsha Lovett used it to explore how students analyze data in the introductory course—actually, in our introductory course, back around 2000.10 Think-aloud interviews allowed her to see the cognitive tasks being applied by students as they analyzed data, and led to a simple teaching intervention targeting one specific cognitive task that then improved their performance on another data analysis problem. Ken Koedinger and Elizabeth McLaughlin later showed that these targeted interventions can work better than just providing extra practice solving problems.11
Now, ideally we could build on that work to develop a full cognitive task model of how students analyze data, break down the pieces in great detail, and then examine how all our courses cover the constituent skills as we lead students to graduation. But this is a fairly intimidating ensemble of skills, and data analysis is a very open-ended outcome.
Instead, TeachStat group members Josue Orellana and Mikaela Meyer started with a different problem. They started by considering how students approach simple mathematical statistics problems on topics like conditional and marginal distributions, maximum likelihood, and expectations and variances. They hypothesized there are at least four separate cognitive tasks involved: after reading the question, the student must
To explore if this framework was correct, and to see which specific skills students struggle with, we conducted think-aloud interviews. We recruited volunteers from 36-226, our undergraduate introductory mathematical statistics course. Students in this class have already taken a probability course, and calculus is listed as prerequisite. We also recruited statistics and data science Ph.D. students as experts, so we could contrast student approaches to problem-solving with expert approaches. And we drafted 25 questions on the statistics topics, supplementing these with some questions about basic calculus, so we could locate gaps in mathematical understanding. All questions were checked for consistency with the notation and terminology used in the course.
Eventually we conducted 16 interviews with novices and 8 with experts. All were 60 minutes long, and we recorded all of the answers so they could later be transcribed and coded.
Here’s one example. We asked the participants to find the maximum likelihood estimate for the mean of a normal distribution, given n samples:
The log-likelihood for x_1, x_2, \dots, x_n iid samples from a univariate normal distribution is
\log L(\mu, \sigma) = - \frac{n}{2} \log(2 \pi \sigma^2) - \frac{1}{2\sigma^2} \sum_{i=1}^n (x_i - \mu)^2.
Find \hat \mu_\text{MLE}.
The ideal solution would involve taking the derivative with respect to \mu, setting it to zero, and finding the maximum in terms of x_i. You can probably imagine several ways students could mess this up, based on the cognitive tasks we described. Students might not know which variables are relevant, and take the derivative with respect to the wrong thing. Students might not know the relevant rule, and hence not know they need to take a derivative to maximize. Students might mess up the algebra or calculus as they implement the rule. Our interviews let us isolate these reasons.
In the interviews, we found that as you’d expect, experts immediately knew the procedure and the answer. They commented that the answer must be the sample mean, but they’d take the derivative to be sure.
For students, things were a bit different. One student reported that “I always get weirded out when I have to do the derivative of a sum, like I don’t really know if there’s rules…” We saw this confusion several times across multiple questions and students. Students seem confused by the summation symbol and don’t know how to take derivatives.
But more importantly, several students showed confusion about the relevant variable. Here’s a representative quote from a student who didn’t know what variable to differentiate:
So we just take the derivative of this with respect to… what do you call it, sigma, right? … Or is [it] with respect to sigma, or with respect to mu?
Another student wanted to take the derivative with respect to x.
Only 4 of the 11 students who answered this question in interviews got it right, despite it being essentially the bread and butter of a mathematical statistics course. And it seems several cognitive tasks are implicated. It’s possible, following Koedinger’s experiment that I mentioned earlier, that targeted practice on the specific skill of identifying which variable is relevant might improve student performance substantially. We’re hoping to find out soon.
Unfortunately we have not yet transcribed and coded many of the interviews, so I can’t go into much more depth about what we found. We will be transcribing and coding more questions soon to summarize the cognitive tasks in more detail and, ideally, find an intervention to experiment with.
Oh—and as an aside, one problem we noticed consistently in our interviews was the Greek alphabet. Statistics often uses symbols like \mu, \sigma, \theta, and so on, but we repeatedly saw that students cannot recognize or name these symbols. Can your lectures be successful if students do not know what you’re referring to when you mention \mu or \sigma and point at a derivation on the board?
Let’s review the story so far.
Over the past two years, our group has conducted more than 60 think-aloud interviews with students at the introductory and sophomore level. In the introductory course, this has helped us develop dozens of assessment questions and isolate many misconceptions. We’ve also collected pre- and post-test data for hundreds of students at three separate institutions, leading to a preprint summarizing our results (and the data is available too). Separately, in the sophomore mathematical statistics course we have begun to break down the cognitive tasks involved in doing mathematical statistics problems, so we can see which tasks are most difficult for students.
So what do we plan next?
First, we’d like to use think-aloud interviews and cognitive task analysis to explore some specific topics more deeply. We’re currently working on questions and interviews to explore how students understand correlation and causation, for example, and we’d also like to explore their understanding of populations and sampling distributions. (There is also a surprising amount of confusion about the interpretation of histograms, which should be explored.)
Second, we’d like to use the interviews and psychometric analysis (such as item response theory) to further refine our assessment questions and produce a set of questions that reliably measure specific introductory concepts. We’re not sure that a single validated instrument, like CAOS or other concept inventories, would be as useful as a collection of questions on various topics that we can choose from as needed.
But having the questions will enable our third goal: designing and evaluating new teaching strategies based on our results. Once we thoroughly understand how students misunderstand a statistical concept, and we have assessment questions that reliably measure their understanding, we can revise our teaching and measure whether the new strategy works. And we can base our new teaching strategy on our research and prior results about student learning, rather than on our intuition about what explanations might work best.
We can then work gradually upwards through the statistics curriculum. Many years from now, I would love to be exploring the cognitive tasks involved in open-ended data analysis tasks such as regression reports and consulting projects, since open-ended analysis is the quintessential expert skill requiring “statistical thinking”, practice, and experience. Perhaps, with the aid of technological tools, think-aloud interviews, and careful experiments, we can begin to see how experts approach data analysis and help guide our students to think more like experts.
Carnegie Mellon University’s GSA/Provost GuSH Grant funding was used to support portions of this project. Many thanks to all the students who participated in interviews and assessments, making this research possible. Thanks also to Joel Greenhouse and Nynke Niezink for sharing their experiences teaching mathematical statistics, and to David Gerritsen for a tutorial on conducting think-aloud interviews.
R. DelMas, J. Garfield, A. Ooms, and B. Chance, “Assessing students’ conceptual understanding after a first course in statistics,” Statistics Education Research Journal, vol. 6, pp. 28–58, November 2007.↩
B. Chance, J. Wong, and N. Tintle, “Student performance in curricula centered on simulation-based inference: A preliminary report,” Journal of Statistics Education, vol. 24, no. 3, pp. 114–126, 2016.↩
T. J. Pfaff and A. Weinberg, “Do Hands-on Activities Increase Student Understanding?: A Case Study,” Journal of Statistics Education, vol. 17, no. 3, 2009.↩
W. K. Adams and C. E. Wieman, “Development and validation of instruments to measure learning of expert-like thinking,” International Journal of Science Education, vol. 33, no. 9, pp. 1289–1312, 2011.↩
K. A. Ericsson and H. Simon, “Verbal reports as data”. Psychological Review, vol. 87, no. 3, pp. 215–251, 1980.
K. A. Ericsson and H. Simon (1993). Protocol Analysis: Verbal Reports as Data (2nd ed.). Boston: MIT Press.↩
The evidence is not yet conclusive on whether vitamin C can prevent or treat the common cold, surprisingly enough: Hemilä H, Chalker E. “Vitamin C for preventing and treating the common cold”. Cochrane Database of Systematic Reviews 2013, Issue 1. Art. No.: CD000980.↩
I. A. Halloun and D. Hestenes, “The initial knowledge state of college physics students,” American Journal of Physics vol. 53, no. 11, pp. 1043-1048, 1985.
J. Clement, “Students’ preconceptions in introductory mechanics,” American Journal of Physics vol. 50, no. 1, pp. 66-71, 1982.↩
R. R. Hake, “Interactive-engagement versus traditional methods: A six-thousand-student survey of mechanics test data for introductory physics courses,” American Journal of Physics, vol. 66, pp. 64–74, 1998.
C. Crouch, A. P. Fagen, J. P. Callan, and E. Mazur, “Classroom demonstrations: Learning tools or entertainment?,” American Journal of Physics, vol. 72, pp. 835–838, 2004.
C. Crouch and E. Mazur, “Peer instruction: Ten years of experience and results,” American Journal of Physics, vol. 69, pp. 970–977, 2001.↩
D. F. Feldon, “The implications of research on expertise for curriculum and pedagogy,” Educational Psychology Review, vol. 19, pp. 91–110, 2007.
C. Tofel-Grehl and D. F. Feldon, “Cognitive task analysis–based training,” Journal of Cognitive Engineering and Decision Making, vol. 7, pp. 293–304, 2013.↩
M. Lovett, “A collaborative convergence on studying reasoning processes: A case study in statistics,” in Cognition and Instruction: Twenty-five Years of Progress (S. M. Carver and D. Klahr, eds.), ch. 11, Psychology Press, 2001.↩
Koedinger, K. R., & McLaughlin, E. A. (2016). “Closing the loop with quantitative cognitive task analysis”. In Proceedings of the 9th International Conference on Educational Data Mining (pp. 412–417).↩